How FJ Labs uses data to make capital allocation decisions in the liquid crypto market.
As discussed in a previous post, FJ Labs has allocated $30m of the core fund to a liquid crypto strategy. Our investment process is comprised of both an evaluation phase and a data due diligence phase. The below post outlines how we approach the data aggregation and discovery.
Regression
After we have discussed an asset in our investment committee, we move it from the “Research” phase to the “Data Due Diligence” phase of our process. Before creating our dashboards for each vertical, we first define which key metric categories matter if we want to track growth and competitive position within a given vertical.
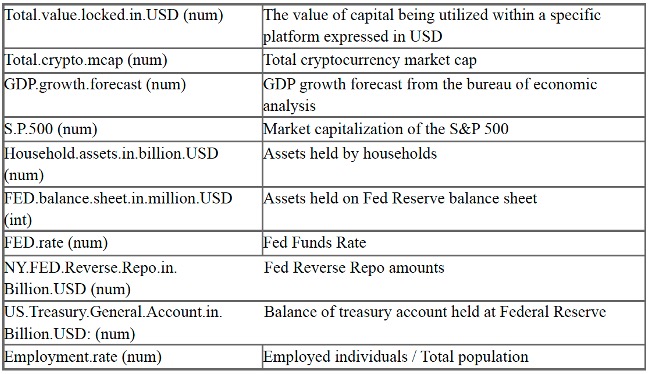
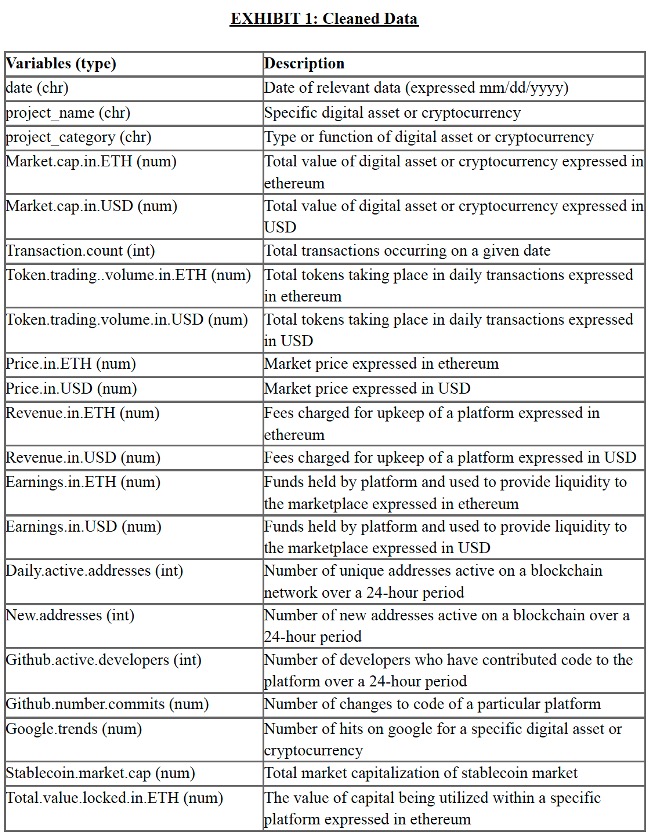
To do this, we regress a robust set of independent variables against the change in asset price for every asset in a given vertical. These independent variables are shown below, and comprise both macro and project specific factors.
*Note – the below analysis provides only a high-level example of our strategy. In practice we use a different, far more robust, set of independent variables for each vertical.
Macro Data Set

Crypto Metric Data Set

The output of these regression models provide insight into which fundamental metrics are most significant for each crypto vertical we invest in. These variables then inform which data we track for each of our crypto vertical dashboards.
Real-Time Data Insights
In the crypto space, most code is open source and everything that happens on the blockchain is transparent (barring zk and other technical obfuscation). This means that, with sophisticated data science capabilities, we can aggregate the most relevant metrics for each vertical we invest in, and track these metrics over time to better understand how use of different blockchains and decentralized applications evolve over time.
For each vertical, we create a suite of data dashboards, which provide a comprehensive view of activity for that vertical, and a fundamental source of truth upon which we can base our investment and trade management decisions.
Below we will provide an example of how we use these dashboards to make data-driven decisions around capital allocation and investment sizing for the “Layer 2” vertical.
*Note – The below data dashboard case study focuses on the Layer-2 vertical for Ethereum. After completing this dashboard build, we realized the data insights would be valuable to the broader Ethereum community. We applied for and received an Ethereum Foundation grant to build out the interface and open-source the dashboard. The resulting interface can be found at growthepie.xyz. Enjoy!
A Layer 2 Case Study
With the proliferation of Layer 2 execution environments, decentralized applications that were formerly built on the Ethereum base chain have migrated to Layer 2 execution environments for faster settlement times and lower fees.
One type of Layer 2 execution environment is “Optimistic Rollups”, the leaders of which are Arbitrum and Optimism.
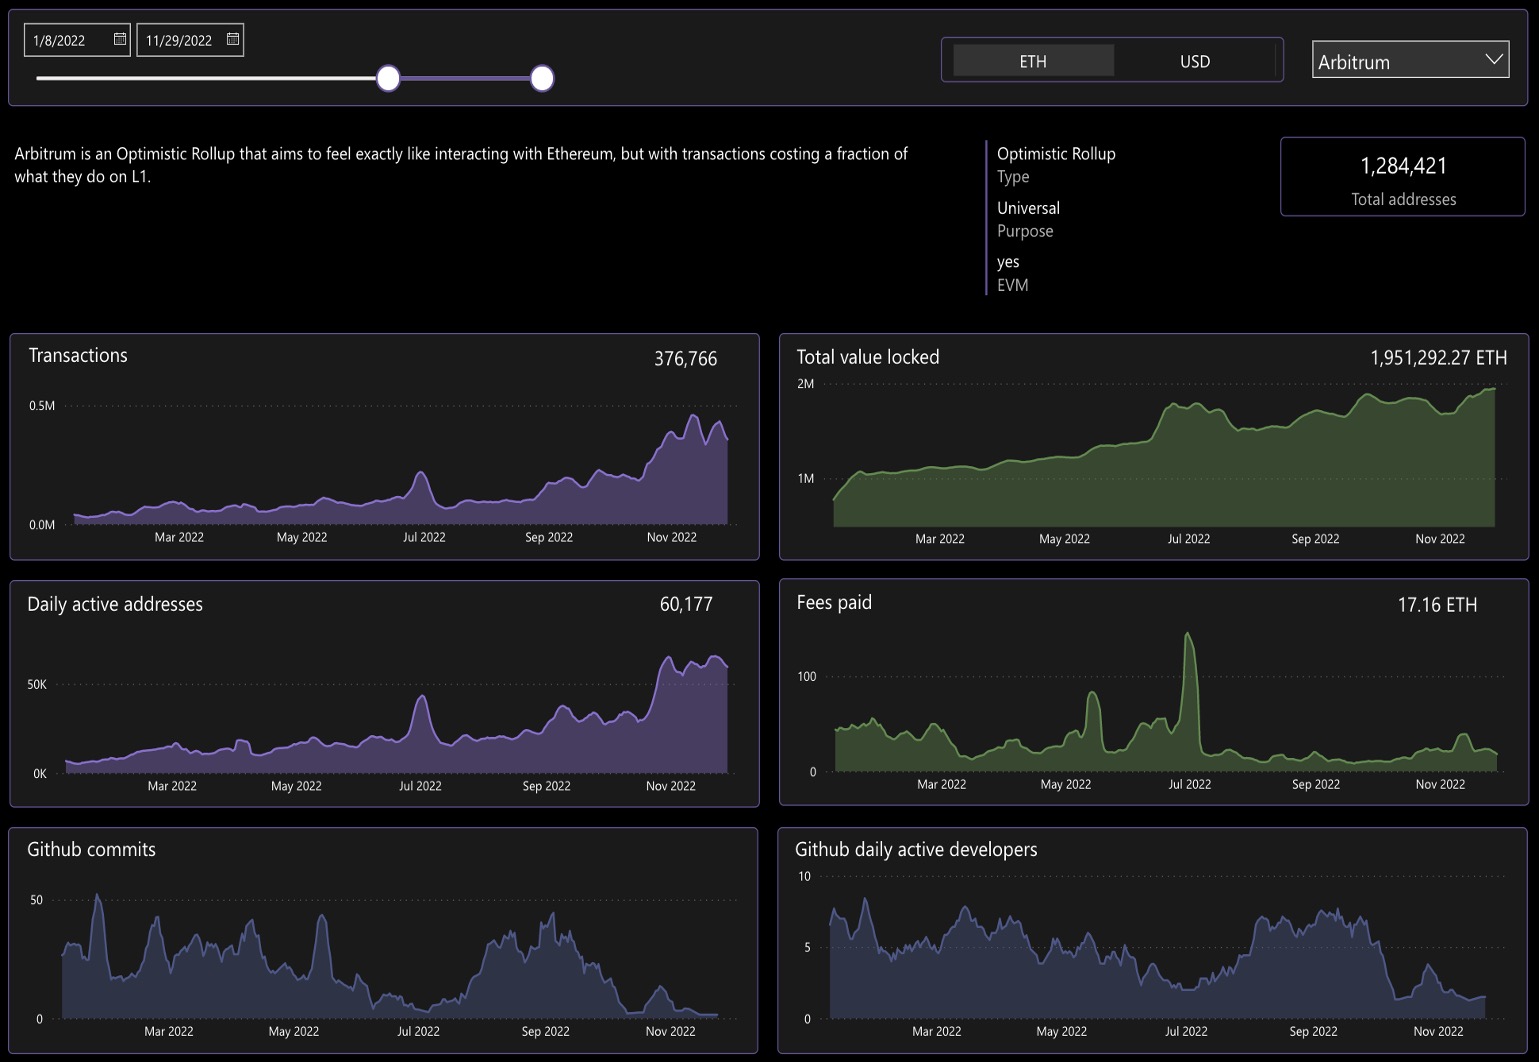
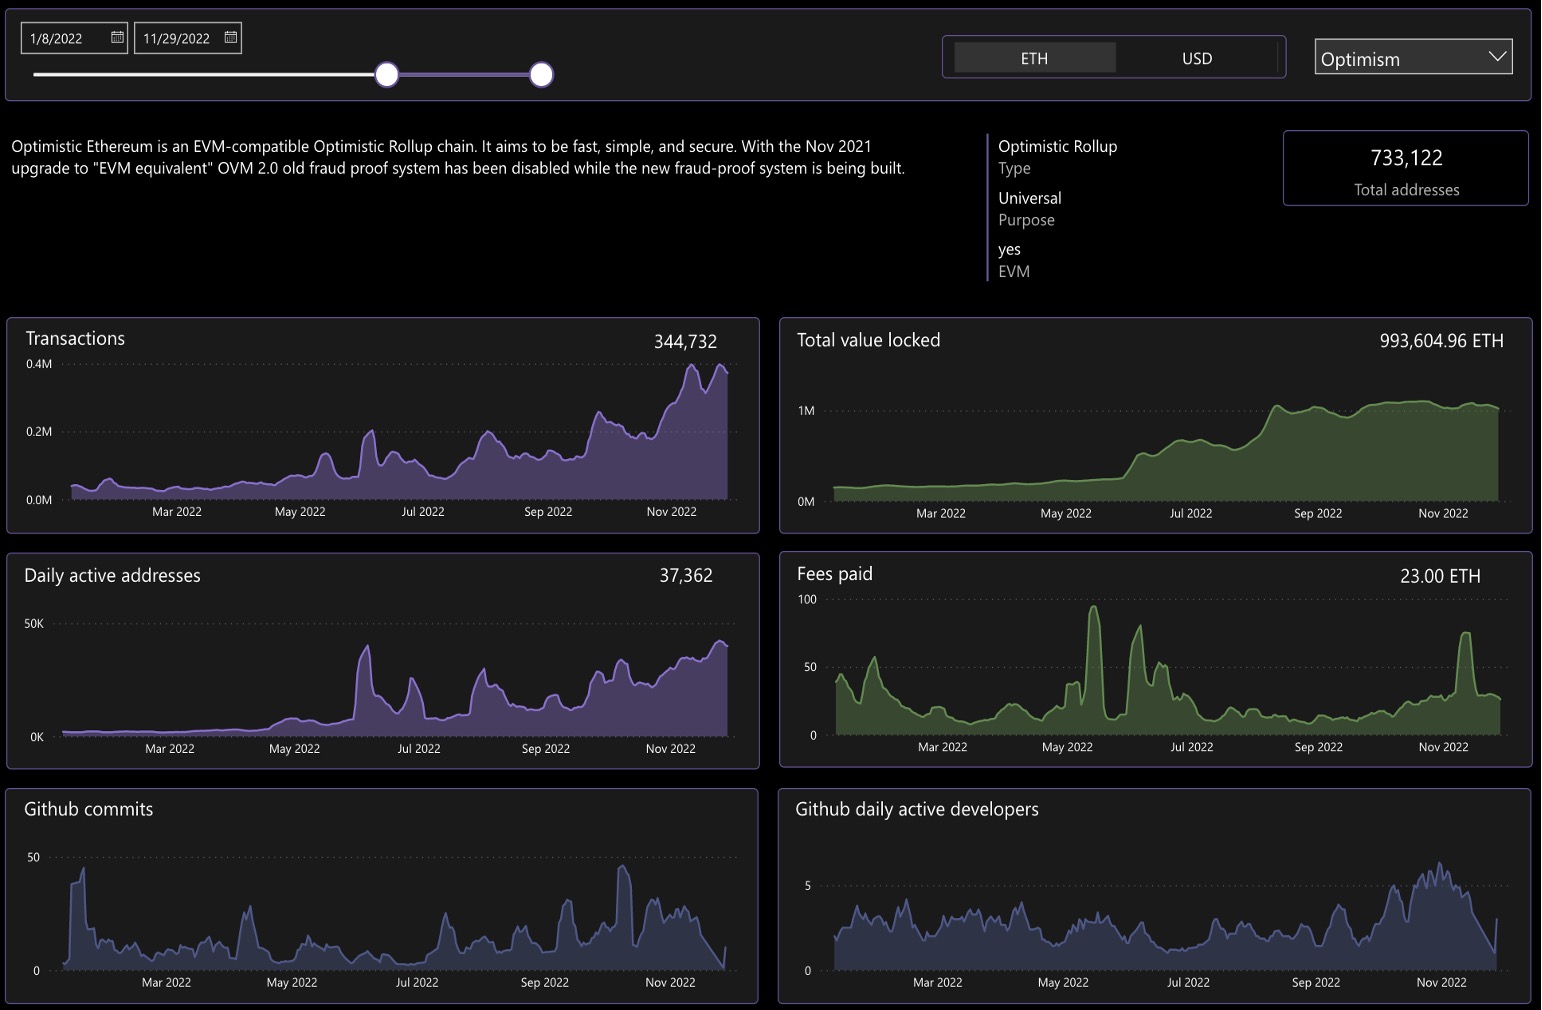
The first step in our analysis involves aggregating and cleaning data across Ethereum, Arbitrum, and Optimism to create a high-level view of how these different ecosystems are growing or contracting relative to one another.
Ethereum

Arbitrum

Optimism

Deriving Insights and Making Capital Allocation Decisions
Using the insights from these dashboards, we can determine which of these layer 2 ecosystems is growing fastest across the metrics that we think matter for this vertical. Once we make an investment decision, we can also track these investments and compare their fundamental metrics to other assets in the same vertical. Through this process we can stay exposed to the projects with the most promising metrics in each vertical we invest in.
Expanding Our Analysis Across All Ecosystems
Using the same process shown above for Layer 2s, we have built a set of high-level key metric views and fine-grained analysis dashboards for all of the verticals we track across the crypto space (currently 19 verticals).
As the space grows, and activity gravitates toward different ecosystems and execution environments, we believe we will be able to make more rigorous, data-driven capital allocation decisions in advance of price movements across multiple verticals.
